Datasets
The cohorts croma is evaluated on. Each pairs a biological label with a non-biological
confounder – the medical center that contributed the sample – so that a representation
organizing by center rather than by biology is visible as a low score rather than hidden
inside an accuracy number.
Benchmark |
Level |
Biological label |
Confounder |
Samples |
|---|---|---|---|---|
Camelyon |
tile |
breast lymph node: tumour / normal (2) |
medical center (2) |
20,400 tiles |
TCGA-4×4 |
tile |
cancer type (4) |
medical center (4) |
5,760 tiles |
Tolkach-ESCA |
tile |
oesophageal tissue (6) |
medical center (3) |
9,000 tiles |
PCaBiop |
slide |
prostate: benign / cancer (2) |
medical center (2) |
1,000 slides |
Camelyon, TCGA-4×4 and Tolkach-ESCA come from the PathoROB study. PCaBiop is a collection of prostate biopsies sourced from PANDA; it backs the paper’s slide-level analyses and is evaluated on a smaller, whole-slide model panel, so it has its own page under Results rather than a row in the tile-panel aggregate (see the published roster).
What the confounder looks like
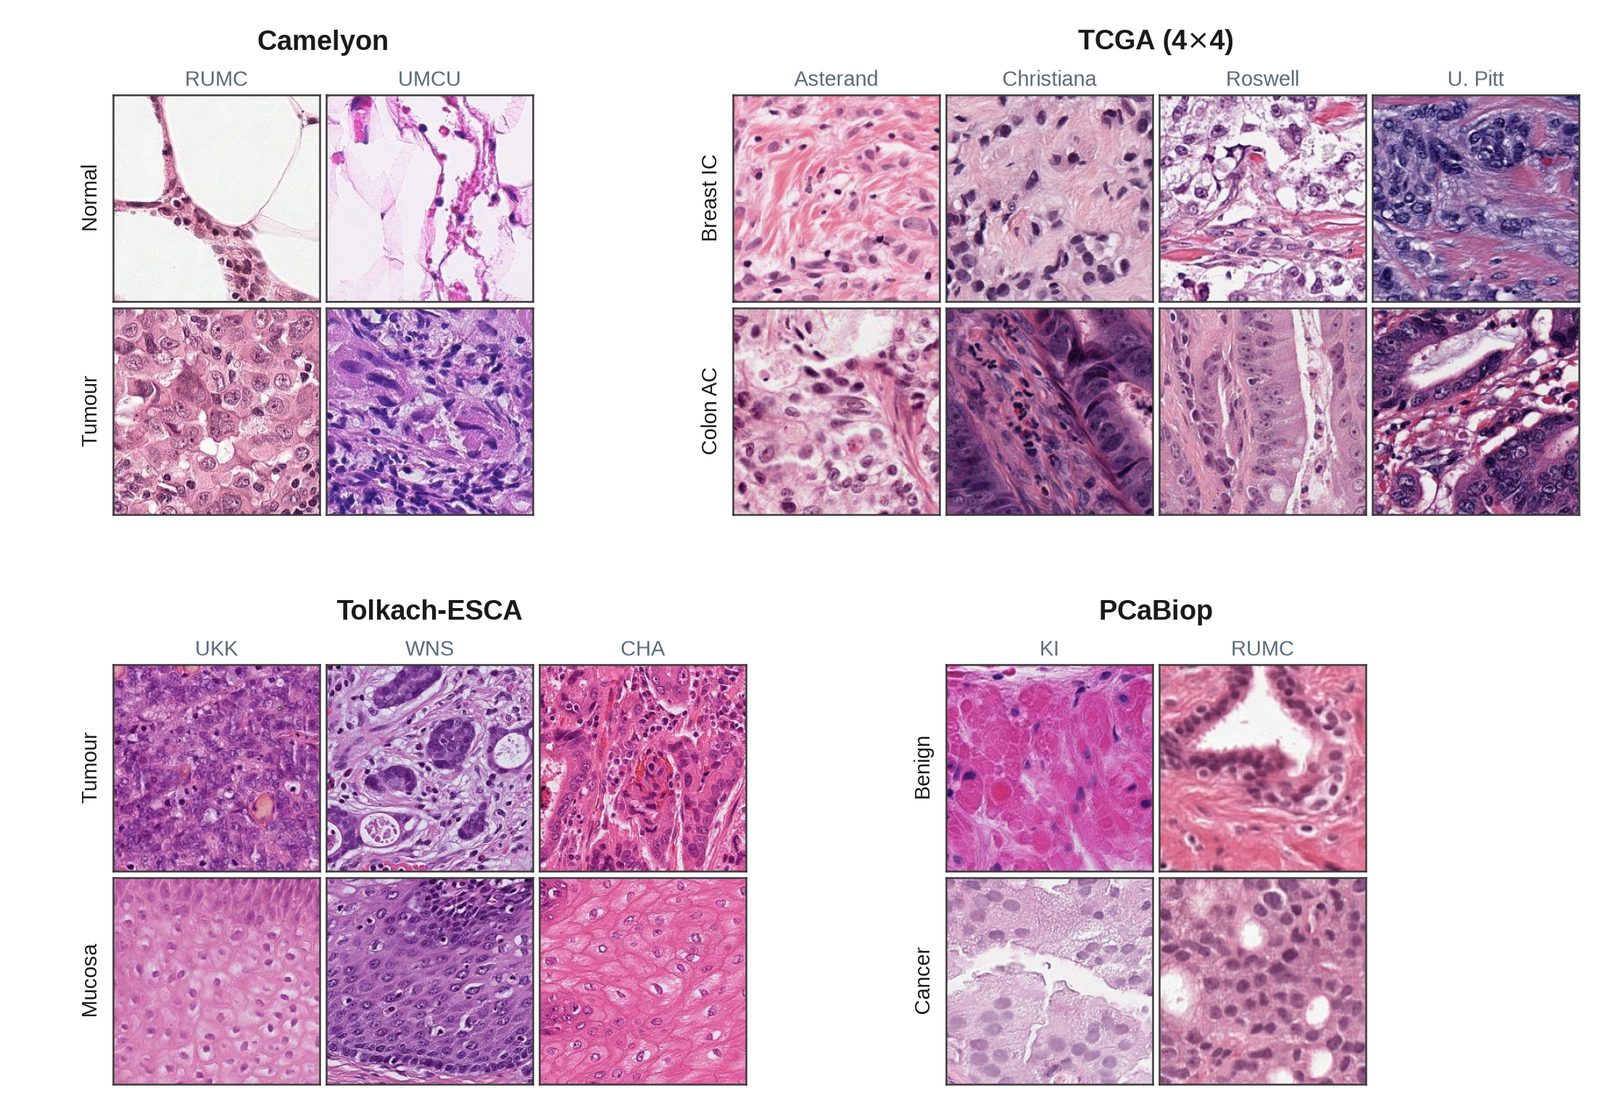
The same biological class, rendered differently by different centers. Rows are biological classes, columns are acquisition centers. Staining, contrast and texture shift with the center while the biology does not – the variation the metrics are designed to catch.
Balance
Every benchmark is balanced across the biological class and confounder grid, so a score cannot be driven by an uneven cell.
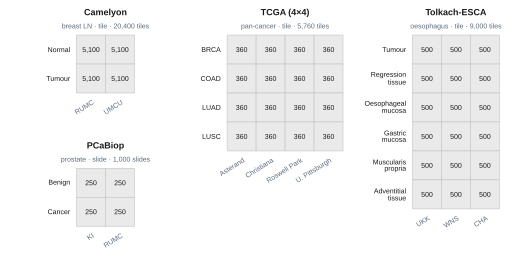
Evaluated samples per class x center cell: 5,100 tiles for Camelyon, 360 for TCGA-4×4, 500 for Tolkach-ESCA, and 250 slides for PCaBiop.
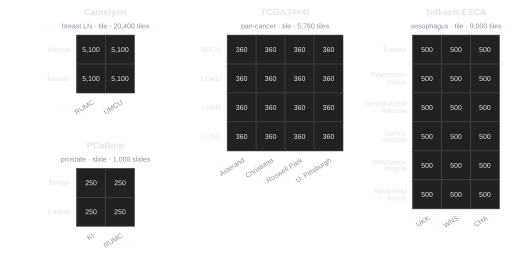
Evaluated samples per class x center cell: 5,100 tiles for Camelyon, 360 for TCGA-4×4, 500 for Tolkach-ESCA, and 250 slides for PCaBiop.
Building your own
Any cohort works, provided it satisfies the manifest contract: one row
per sample with a label, a group_id, and a confounder column of your choosing. See
How big must it be? for how large the neighbourhood scope needs to be before the defaults are
usable.